Real hardware readings
RAPL on Linux, Apple energy counters on macOS, the Energy Meter Interface on Windows, and NVIDIA NVML for GPUs. The same counters the hardware uses to manage its own power.
Not TDP × utilisation.
Energy monitoring for your code
EcoCode reads your machine’s real energy counters and shows you exactly what your code uses. Energy, carbon and cost, live, on Linux, macOS and Windows.
123456789
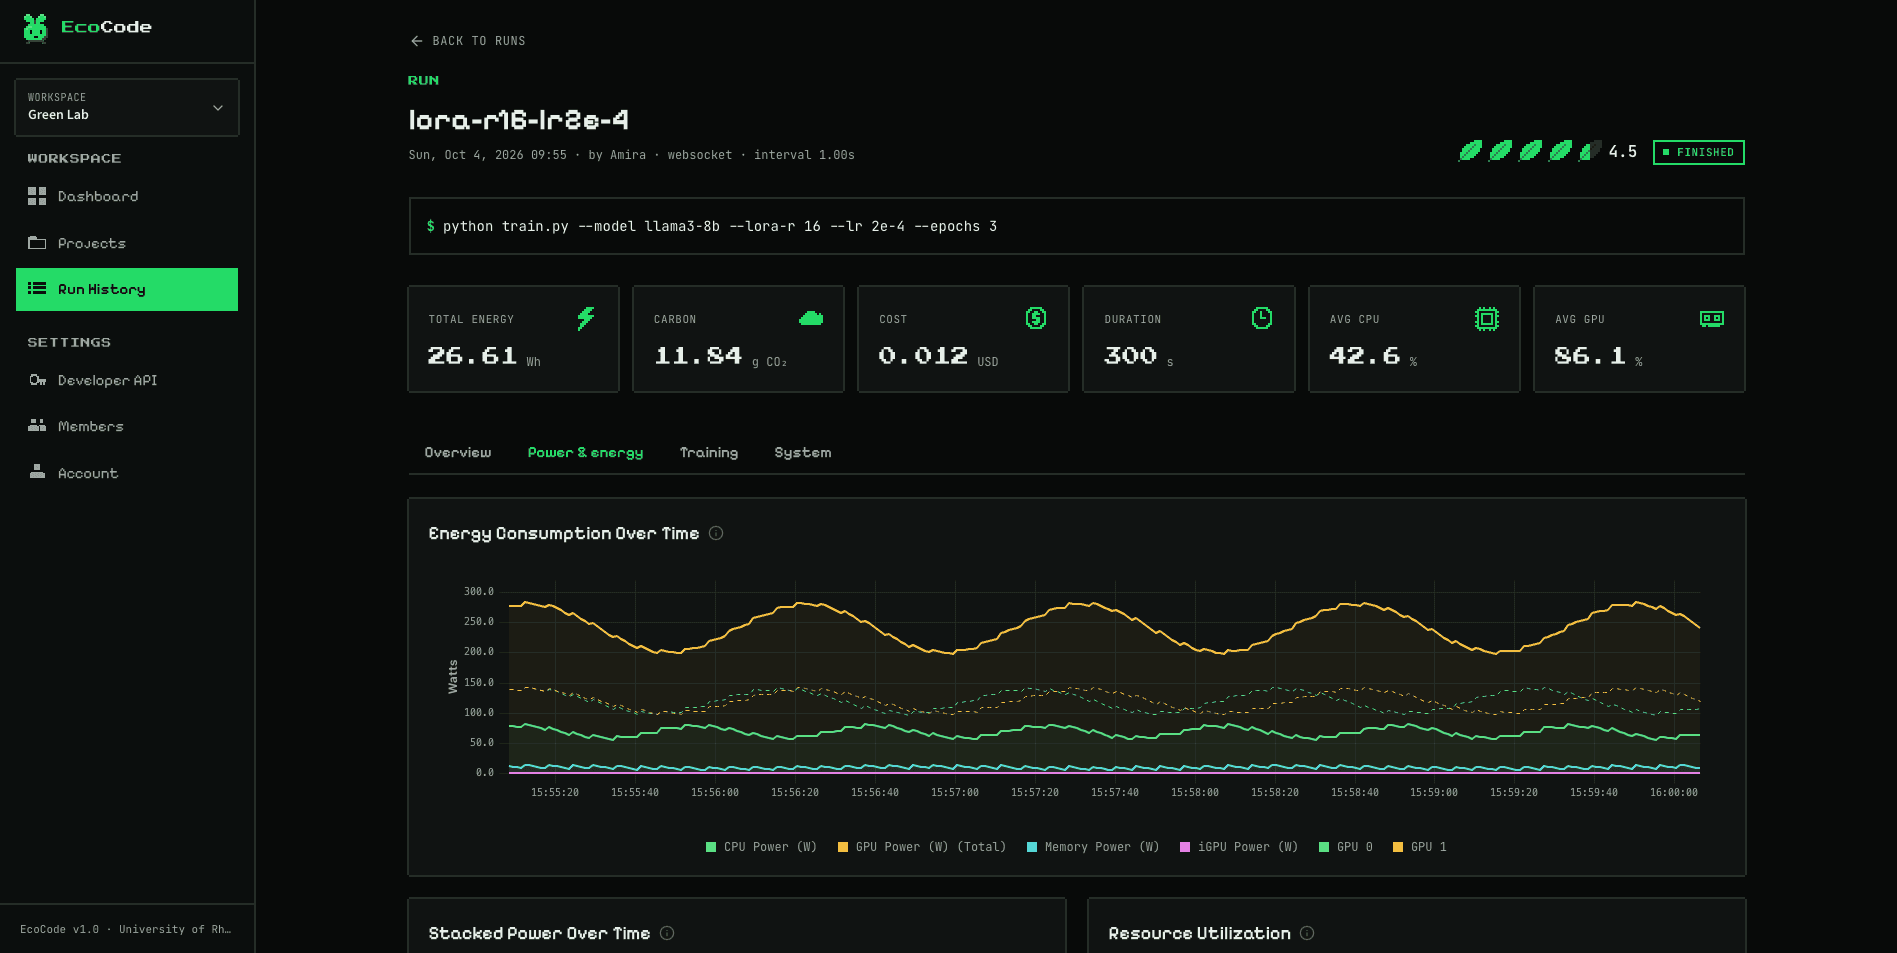
Live run view. Charts update every second while the run is in progress.
What EcoCode does
Most energy tools estimate from manufacturer TDP figures. EcoCode reads what the hardware reports and tells you how much of it was yours.
RAPL on Linux, Apple energy counters on macOS, the Energy Meter Interface on Windows, and NVIDIA NVML for GPUs. The same counters the hardware uses to manage its own power.
Not TDP × utilisation.
CPU and memory energy are split by the share your process tree actually used. Each GPU is read independently from its own energy counter and attributed by per-process utilisation.
Per socket, per GPU.
Wrap anything with the CLI: python, node, a compiled binary. Inside Python, add phase, step and loss markers so energy lines up with what the model was doing.
Zero changes to the target program.
Charts update every second while a run is in progress. Group runs into projects, share a workspace with your team, and get carbon, cost and a 0.5 to 5 leaf rating for every run.
Carbon from Ember grid data for your country or US state.
How it works
No agent to deploy, no infrastructure to manage. The dashboard is hosted; the measuring happens on your machine.
One package on Linux, macOS and Windows. The wheel bundles the ecocode binary. Homebrew and winget manifests are available too.
Create a free account, generate an API key under Settings, and either wrap your command with the CLI or add a few lines of Python.
Energy, carbon and cost stream to the dashboard while the run is still going. Compare runs side by side when it finishes.
pip install ecocode# see what this machine can measureecocode doctor
ecocode config set-api-key eco_...# wrap any commandecocode run -o online --project my-project -- python train.py
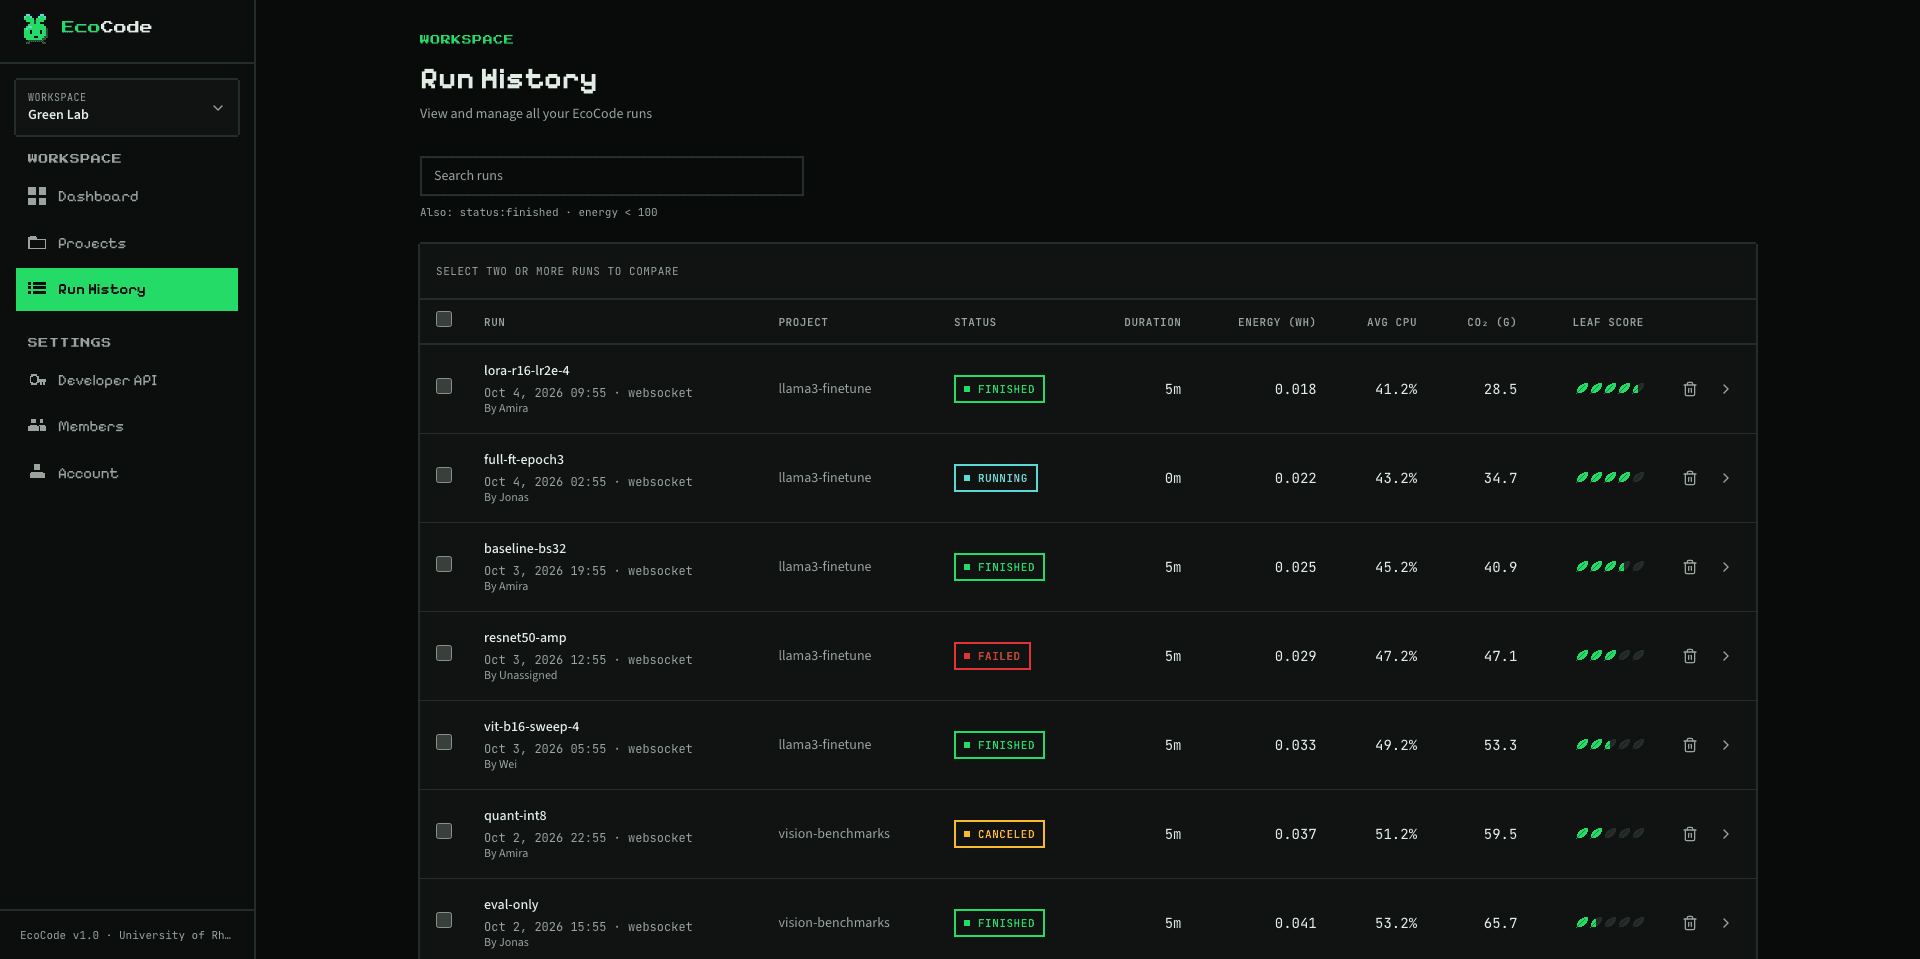
Every run lands in the runs list with its energy, CO₂, cost and leaf rating.
Tool comparison
Against the energy measurement tools most often used in ML and systems research. Partial means limited or conditional support; details below.
| Capability | EcoCode | CodeCarbon | Scaphandre | CarbonTracker | Kepler |
|---|---|---|---|---|---|
| GPU energy from the NVML energy counter | |||||
| Per-process GPU attribution | |||||
| Per-socket, per-domain CPU and DRAM energy | |||||
| Monitor any process, any language | |||||
| macOS and Windows support | |||||
| Built-in live dashboard | |||||
| Team workspaces | |||||
| Prometheus export | |||||
| Live grid carbon intensity |
Framework integrations
Callbacks for HuggingFace, TRL, Lightning, DeepSpeed, vLLM, Keras and ONNX Runtime. Phases, steps and loss are recorded alongside the energy data.
import ecocode from ecocode.integrations.huggingface import EcoCodeCallbackwith ecocode.run("sft-llama3", exporter="online", api_key="eco_...") as eco_run:trainer = Trainer(model=model,args=TrainingArguments(...),callbacks=[EcoCodeCallback(eco_run)],)trainer.train()
Free to get started
Free account, hosted dashboard, nothing to deploy. Real hardware readings from the first run.
import ecocode

# That's it. Wrap your existing training loop:
with ecocode.run("my-experiment", exporter="online", api_key="eco_...") as run:
    ...